 When working with medium to large scale networks, IT departments are often faced dealing with network loops and broadcast storms that are caused by user error, faulty network devices or incorrect configuration of network equipment. Network loops and broadcast storms are capable of causing major network disruptions and therefore must be dealt with very quickly.
There are two kinds of network loops and these are routing loops and physical loops.
Routing loops are caused by the incorrect configuration of routing protocols where data packets sent between hosts of different networks, are caught in an endless loop travelling between network routers with incorrect route entries.
A Physical loop is caused by a loop link between devices. A common example is two switches with two active Ethernet links between them. Broadcast packets exiting the links on one switch are replicated and sent back from the other switch. This is also known as a broadcast storm.
Both type of loops are capable of causing major network outages, waste of valuable bandwidth and can disrupt network communications.
We will show you how to detect routing loop and physical loop with a network analyzer such as Colasoft Capsa or Wireshark.
Download your copy of Colasoft Capsa - a professional network analyzer designed to help locate and deal with network and protocol problems.
We’ve selected Colasoft Capsa 8.0 as our preferred packet analyzer because of its new feature that allows the quick diagnosis of routing loops and physical loops.
Note: To capture packets on a port that's connected to a Cisco Catalyst switch, users can also read our Configuring SPAN On Cisco Catalyst Switches - Monitor & Capture Network Traffic/Packets
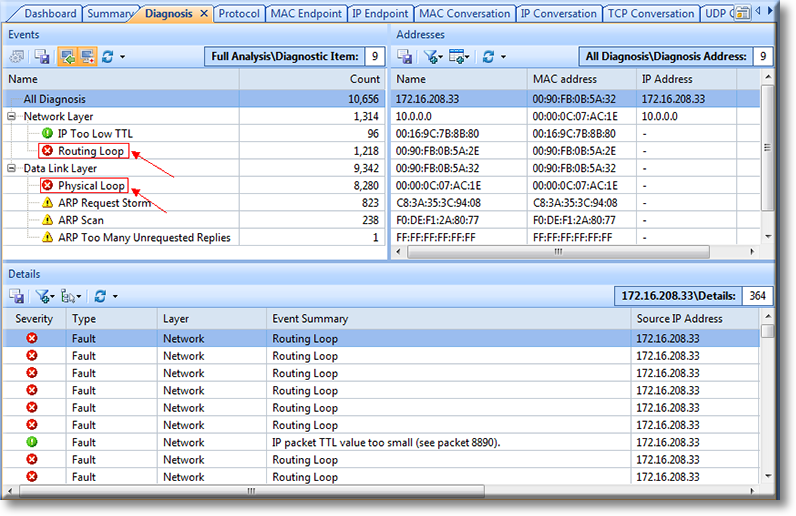
If there are routing loops or physical loops in the network, Capsa will immediately report them in the Diagnosis tab as shown below. This makes troubleshooting easier for network managers and administrators:

Figure 1. Capsa quickly detects and displays Routings and Physical Loops
Further examination of Capsa’s findings is possible by simply clicking on each detected problem. This allows us to further check the characteristics of the related packets and then decide what action must be taken to rectify the problem.
Drilling into our Captured Information
Let’s take a routing loop for example. First, find out the related conversation using Filter (red arrow) in the MAC Conversation tab. MAC addresses can be obtained easily from the notices given in the Diagnosis tab: